3D Weather with SceneKit: aka Karl the Fog in AR

By: Jim Martin
Weather is all about volumes of air interacting, and weather forecasting happens with 3D simulations. However, those forecasts are often sliced into 2D snapshots at different altitudes for display on a flat map, and it means you’re missing a lot of crucial details. We worked with The Weather Company to show how SceneKit and ARKit can provide a better understanding of 3D weather patterns.


How we built it
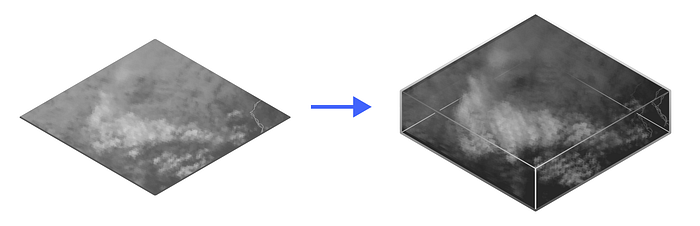
San Francisco’s famous “Karl the fog” and cloud cover are our test-case for 3D weather visualization. We wanted to make sure we had a benchmark for our final result, so used the weather pattern in the satellite imagery above as we built. Finally, we had three goals that when combined, give us an interactive 3D version of these impressive satellite images:
- Use real data
- Visualize weather effects realistically
- Make the app performant enough for mobile AR
Data sources
First, we needed to find an image source for cloud cover to power our visualization. NOAA maintains a public source of imagery from the GOES-16 (Geostationary Operational Environmental Satellites) that covers the entire United States. Explore some of their amazing imagery, updated dozens of times a day.
Even better, RealEarth provides raster tiles of GOES-16 imagery. It isn’t a scalable data source, but it’s quick to add a tileset as a layer using our Maps SDK for iOS, so we used this as the source of ground truth for our clouds.
Rendering 3D volumes from map styles in SceneKit
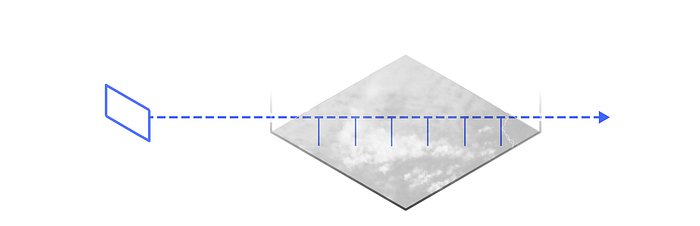
To create performant 3D visuals from our imagery, we used a rendering method called “ray marching.” With this method, we can create 3D volumes from 2D map data by capturing how ‘opaque’ different regions of the map are in our map style.
To implement ray marching in SceneKit, we created a shader program using Metal. For every pixel rendered in the final image, the shader creates a ray that ‘marches’ through the scene, starting at the camera. As the ray moves, it accumulates color from the map view at that position in space. The idea is to use our map’s opacity and color to control where volumes appear, their height, and thickness. Brighter colors on the map mean more dense clouds at that position in the volume:
You can see how we implemented this concept by downloading our sample project, and check out Metalkit.org if you’re interested in learning more about the fundamentals of creating custom shaders on iOS.
Visualizing other datasets
Our examples showed clouds over San Francisco, but anything you can see in a Mapbox style can be used to create these volumes. Check out some other examples of this method in action:


Download the Mapbox SceneKit SDK, or try out the source code for our volumetric weather visualizations. If you want hands-on help, join our 3D visualizations with SceneKit live session coming up on August 23rd or participate in our Explore Outdoors challenge to show off your new skills and win amazing prizes.