Designing the Vintage style in Mapbox Studio
What makes a vintage map look “vintage”? Printing imperfections, discolored paper, and antiquated label names all play a part. Achieving this old-timey aesthetic on a digital map was a fun challenge to take on with Mapbox Studio.
Here are a few tips for adding character to your thematic maps in Mapbox Studio.
Creating a vintage texture
Vintage maps have texture that speaks to their age and use. Many vintage maps used an Intaglio printing process that rolls ink on a metal plate (copper or zinc) that’s been etched or engraved with the design. The repeated application and removal of ink leaves behind residue adding fragments of authenticity.
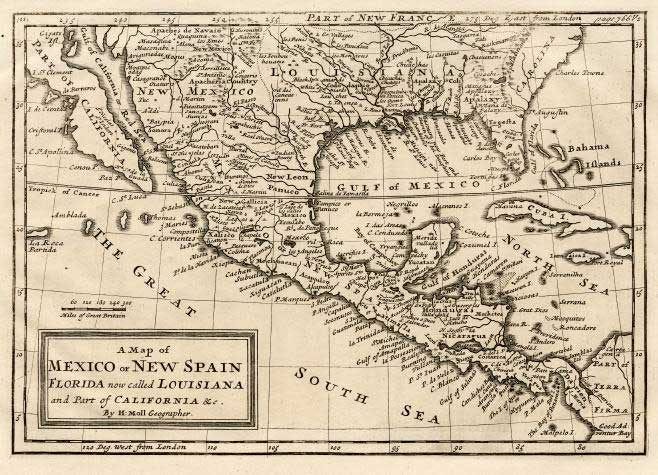
“A Map of Mexico or New Spain, Florida now called Louisiana”, 1708. Copper plate engraving by H.Moll.
To achieve this look, I created an SVG pattern to mimic this texture and imperfection. I used a varied dot pattern with seamless edges for tiling, and a transparent background to allow for layering.

My next task was finding a custom dataset to accentuate this texture.
Adding custom data
Many classic maps contain detailed styling on the oceans and bodies of water surrounding the continents. This styling shows bathymetry, the measurement of the depth of water in oceans, seas, or lakes. The same way that topographic maps represent three-dimensional features (or relief) of overland terrain, bathymetric maps illustrate the land that lies underwater.
Adding a bathymetry dataset to my style gave me more layers for texturing and made the map feel more antique.
Natural Earth is a great resource for data that is globally geo-referenced and contains physical and culture features. I downloaded the bathymetry dataset, which contained seven shapefiles of nested polygons for each depth based on imagery from SRTM (Shuttle Radar Topography Mission) Plus.

“First printed map of oceanic bathymetry produced with data from USS Dolphin 1853.”
Layering in texture with custom data
The final map design contains about six stacked layers per bathymetric feature. In Mapbox Studio, I added my SVG pattern to each layer, altered the opacity, and added layers of soft brown (#CFB29C) in varying values of light and dark.

Explore now
Explore the final Mapbox Vintage map!
Learn more about how to style with Mapbox Studio: