Mapping 70 billion pain pills by pharmacy location
How the Washington Post built a new view of the Opioid Epidemic in America

By: Lem Thornton
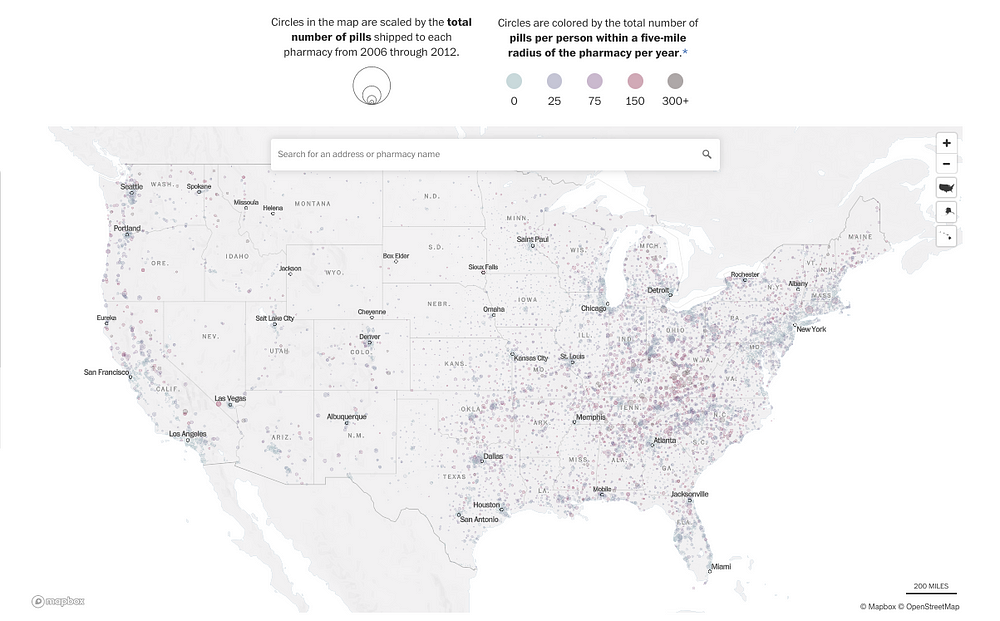
Half of the 70 billion opioid pills distributed across America were handled by only 15 percent of the 83,000 pharmacies in this country. This and other facts were brought to life this month in an interactive data visualization from The Washington Post.
The article is part of The Opioid Files, an ongoing WaPo investigation into the crisis inspired by a previously unreleased dataset from the Drug Enforcement Administration. The Investigative and Graphics teams have been posting maps with an increasing granularity of the data.
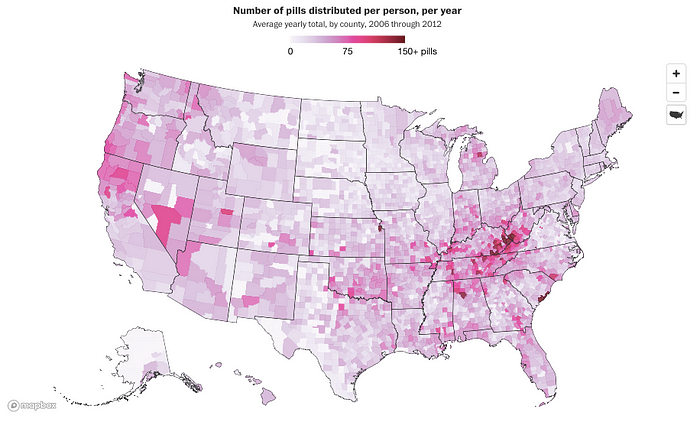
The first article published last month assigned the cleaned-up data to counties and to Vector Tiles using Tippecanoe. The team used a process similar to the Dirty Reprojectors app to create an Albers projection and using Mapbox GL got in online. This view highlighted areas where the epidemic had hit the hardest.

The pain pill map brought even more granularity, visualizing pain pill distribution by local pharmacy locations, which were each individually searchable.

The Post team used the gl geocoder to add search functionality by pharmacy, in addition to city and county. Mapbox’s current GL Geocoder makes it simple for you to implement our stock geocoding resources, but also allows you to easily sub in your own data as well.
“I wanted you to be able to search ‘Rite Aid’ and ‘Louisiana.’ We externally loaded (data into the geocoder) and set up a local geocoder, which the gl geocoder allowed us to do.” — Armand Emamdjomeh, Washington Post Graphics Reporter
The Post team intends to continue digging into the data. They’ve also made the cleaned dataset openly available to all outlets looking to report on their own community.
“I hope people are able to use it to see what’s happening around them as well as some of the places that have been hardest hit by the epidemic.” — Armand Emamdjomeh, Washington Post Graphics Reporter
Are you mapping big data sets for journalism? Share what you’re building with #builtwithmapbox and reach out to our team if you need support.


