Tableau’s global community is building with Mapbox

By: Eric Gundersen
Starting today, Mapbox vector maps now power mapping and geographic visualizations in Tableau. From Tableau’s announcement:
“Location data is growing in demand as more decisions are now based on ‘where.’ In fact, a recent analyst report indicates that by 2022, 30% of customer interactions will be influenced by real-time location analysis, up from 4% in 2017. Tableau’s new vector based maps offer greater detail and a smoother browsing experience than image-based mapping products. This means when customers zoom or pan, Tableau scales the map accordingly vs. loading images, no longer breaking customers from the flow of their analysis. Mapbox’s leading technology also provides new background mapping layers to add context — including subway and train stations, building footprints, terrain, and water labels — to geospatial data.”
With this update, Tableau continues to be at the forefront of BI and visual analytics. Users will get accurate and locale-aware places and boundaries worldwide, as well as high-performance maps that enable powerful analytics at scale, easy customization, and fast data exploration.

Tableau’s commitment to providing powerful location analysis tools is a testament to the importance of understanding the where in data. There are already so many amazing examples of map visualizations in Tableau and we’re excited to see where the community takes #vectormaps.
The Tableau and Mapbox story began five years ago, with two developers talking open-source tech at a cartography meetup in Seattle. Tableau had just completed its initial public offering, and Mapbox was a small startup working from a garage on the first vector maps platform.
It was clear even then that Tableau’s mission — to help people see and understand data — offered a radically new way to experience the world that tightly aligned with ours. It was also clear that the two teams shared a relentless focus on cultivating a data-driven ecosystem and empowering users with powerful, elegant tools.
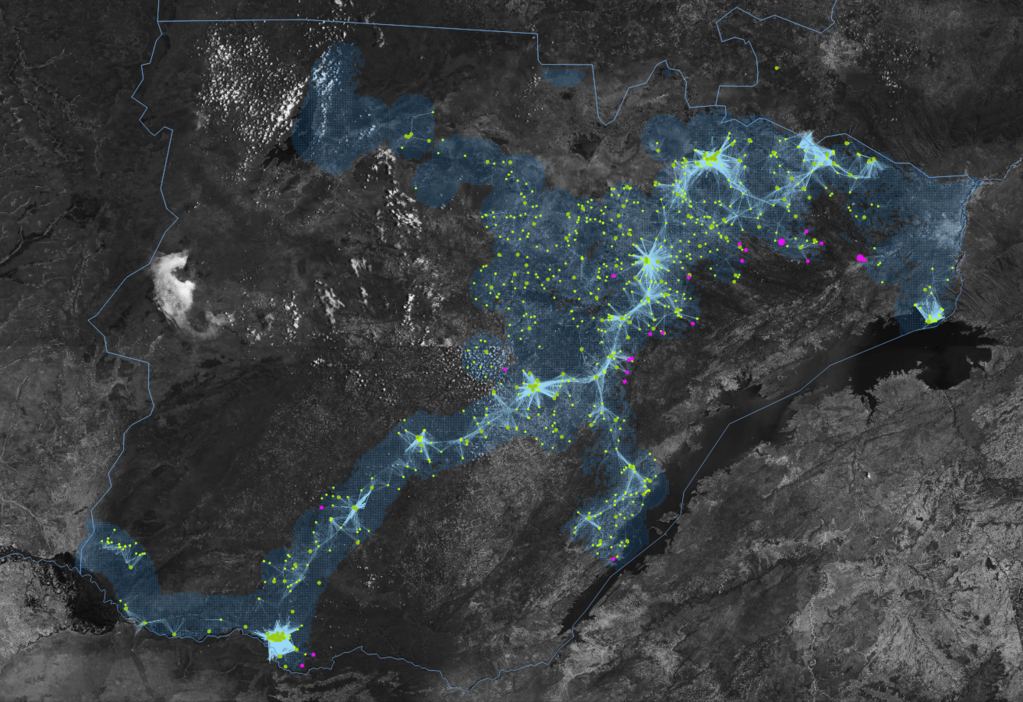
The Tableau community’s positive reaction to the first Mapbox plugin at Tableau Conference 2015 showed we were onto something. They understood the power of a capability within Tableau that put performant maps in immediate reach. Since then, Tableau and Mapbox users have collaborated on a litany of projects, like Allan Walker and Anya A’Hearn’s work with PATH and the Tableau Foundation on the #VisualizeNoMalaria project:
Today’s announcement means our teams will be working together even more closely, and the future of location for business intelligence will be available to even more people.
I’m thrilled to be part of the Tableau community and to help put these (and many more) tools into the hands of Tableau users. We can’t wait to see what you build.