What’s in a Mapbox Studio style?
Mapbox Studio styles are a lot more than meets the eye. Under the hood, every
map relies on a set of APIs and performance-tuned standards working in concert.
Vector rendering has spawned a new approach to cartography: instead of relying
on flattened images as the lingua franca of web maps, we now think deeply
about maps as dynamic mixtures of ingredients. The finished product you see
is a combination of small, optimized components, like tiles, fonts, and icons,
assembled in realtime.

Here’s a map. Let’s look at it layer-by-layer.
Mapbox Vector Tiles

The core of every map is data. Mapbox GL JS supports a variety of data sources,
including GeoJSON, image tiles, video, and static images, but the most important
type is vector tiles. Unlike
conventional vector formats like GeoJSON and KML, vector tiles are efficient
enough to contain all the data you see in a map — including streets,
buildings, and terrain. Our vector tile specification is built on the space-saving
protocol buffers format,
and inspired by many existing efforts, like OpenScienceMap’s
format.
Unlike a vector image format like SVG, vector tiles are pure data. They define
geometries and properties, but never anything about style. This means that the
same vector tiles can be used to generate maps of varying styles — a nighttime
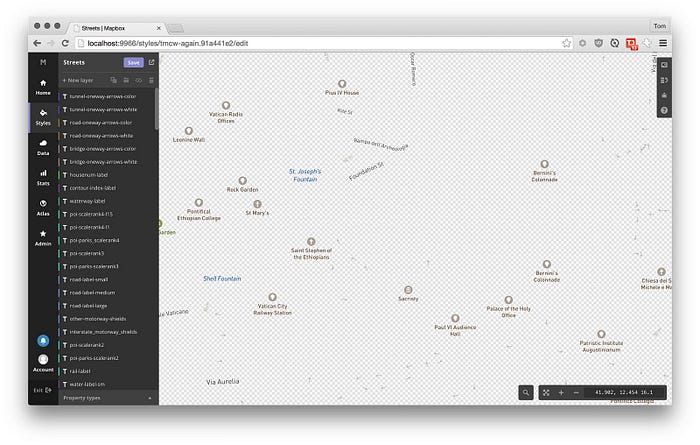
style can use the same data as a light style for visualization. The screenshot
above is generated by Mapbox Studio’s X-Ray mode,
which makes it easier to select data: it auto-generates styles for ‘invisible’
layers of data.
Polygons & Lines

From vector tiles alone, Mapbox Studio can render geometric shapes, like
lines and polygons. The styles for these shapes are defined in the
Mapbox GL Style Specification:
for instance, the buildings layer is controlled by this style:
json
{
 "id": "building",
 "type": "fill",
 "source": "mapbox-streets",
 "source-layer": "building",
 "minzoom": 15,
 "paint": {
 "fill-outline-color": "#c0c0c0",
 "fill-opacity": {
 "base": 1,
 "stops": [[15, 0], [16.5, 1]]
 },
 "fill-antialias": true,
 "fill-color": "#cbcbcb"
 }
}
The layer’s source and source-layer properties tell the renderer
which set of vector tiles (mapbox-streets) and which subset of their data (building)
the layer should read from.
WebGL & OpenGL excel at rendering shapes like these: once we parse the vector
tiles and load geometries into memory, rendering can be extremely fast. Mapbox
GL includes several novel algorithms to perfect tasks like
rendering anti-aliased lines
with high quality and high performance.
Text
Rendering shapes is in WebGL’s wheelhouse, but rendering text isn’t.
Unlike HTML, SVG, and Canvas, GL has no built-in text-rendering methods. There
are two popular techniques to work around this limitation: rendering
individual letters in text as polygons,
or using a 2D Canvas and using
the result as an image.
Maps require text at multiple sizes and orientations, and with customizable halos,
so the commonplace techniques don’t cut it.
Instead, Mapbox’s APIs process all fonts into SDF-encoded
packages of character ranges. We have a few improvements — notably advanced text shaping -
on the horizon, but the approach already incorporates some advanced ideas:
Multilingual by default
The API takes a font stack as its parameter,
rather than a single font. Many beautiful fonts don’t include the full
range of unicode characters, so using them alone would leave your maps
blank in non-English-speaking countries. Using a combination of beautiful
but limited-coverage fonts with comprehensive fallback fonts like Arial Unicode
ensures that maps are usable everywhere.
Character set efficiency
The English alphabet fits comfortably within 128 different symbols,
but other languages use thousands of detailed characters. Loading every symbol
for every language along with your map would be expensive and slow, so
we split the unicode range by 256 character chunks. This way, if you load
a map in Washington DC, only the necessary characters to display English
are loaded, and if you pan to Moscow, the map will load the necessary Cyrillic
characters, on the fly.
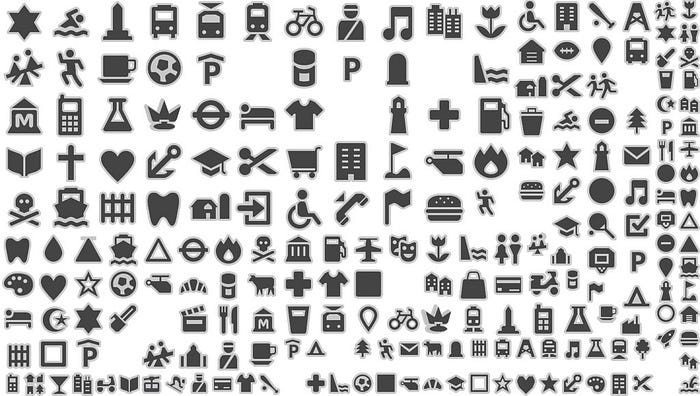
Symbols
Symbols, whether they’re used as icons for points of interest, line markers
for road direction, or textures for landuse classifications, are one of the
essential elements mapmakers use to establish a visual identity.
Mapbox Studio includes a powerful new way to interact with symbols. Much like
fonts, our approach to symbols needed to hit a high level of visual polish
but also be incredibly fast for downloading and rendering.
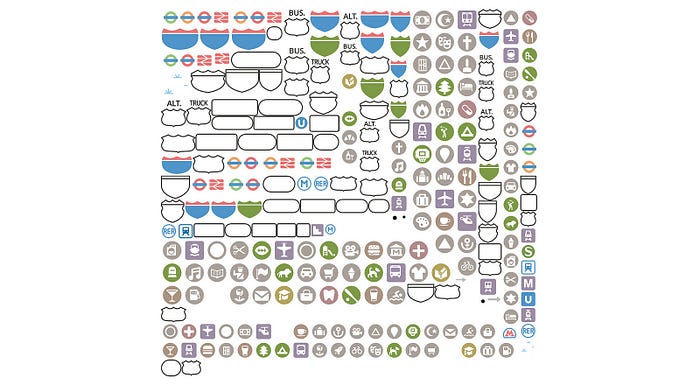
Mapbox Studio uses a new Sprites API that accepts SVG images as input and generates
spritesheets — another
trick borrowed from game design. Below the surface, this API uses
spritezero, a marriage of bin packing
and Mapnik image compositing
into an incredibly fast & accurate package.
This API accepts only SVG inputs, so that we can render the map at any
pixel density, from 1x, to retina displays, and in the future, high-resolution
print output. And you can use open source icon sets, like maki or
geomicons, or design them yourself in Illustrator,
Sketch, Inkscape, or any SVG-supporting vector graphics editor.
In everyday usage
Mapbox Studio styles are actually a lot of things: a style definition
at the core, optimized data as tiles, and a well-tuned system of APIs to
provide supporting assets.
And it’s just as easy to use a Mapbox Studio
style with Mapbox GL JS or
the Mapbox iOS SDK as it is to use
a legacy style with Mapbox.js: all you need is a style ID and an access
token, and you’ve got a map.