Partnering with MicroStrategy to enable data discovery

By: Julie Munro
Today, MicroStrategy released Geospatial Services, a new set of mapping capabilities powered by Mapbox and available across MicroStrategy’s 10.11 platform. MicroStrategy users can now use advanced geospatial analytics to explore their largest datasets and make better-informed business decisions.
With over 20 billion connected devices — growing to 75 billion by 2025 — more and more real-time location data is collected daily. Data from these devices lets retailers track store inventories and math demand to weather trends, healthcare providers monitor seasonal flu outbreaks to target vaccination campaigns, and internet providers monitor their network coverage on a block-by-block basis.
It’s difficult to interpret this massive location data without fast, easy-to-use tools that give users proper context. For example, a global bank will want to see financial transactions grouped by country, then zoom into the billions of individual points for further analysis. MicroStrategy’s new Geospatial Services meet these needs with new capabilities like:
- Vector maps, which improve performance and response times by 300% over traditional tiled maps, including for millions of records.
- Global postal and administrative boundaries that let users bin their data by geographies ranging from Indian postal codes to Chinese prefectures.
- Map style options tailored to your visualization , including basic, light, dark, streets, topographic, and satellite maps.
- Advanced clustering and aggregation capabilities to understand spatial trends in data beyond density.
- Full control of data layers and levels of detail based on a map’s zoom level.
MicroStrategy CTO Tim Lang added that, “When thinking about location analytics, many businesses are looking for specific, actionable results like being able to identify new customers, improve marketing efforts and customer service, manage risks, and understand consumer data. The new integration with Mapbox empowers MicroStrategy 10.11 users to draw greater insights without compromising security.”
Let’s take a look at how the Mapbox capabilities inside Geospatial Services help address two common questions from MicroStrategy users.
Intelligent aggregation
A claims officer for an insurance company using MicroStrategy asks, “What is the risk that a particular house will be damaged by an earthquake?” Turning a USGS dataset of 52,000 earthquakes into a vector map rendered at 60 frames-per-second in MicroStrategy, an analyst can plot global earthquakes and their impact zones to assess risk premiums. The visualization below shows this risk analysis displayed in geographic context — country when zoomed out, provinces when zoomed in, all the way down to individual quakes––to help the claims officer spot trends at a glance without compromising the details.
Drilling-down
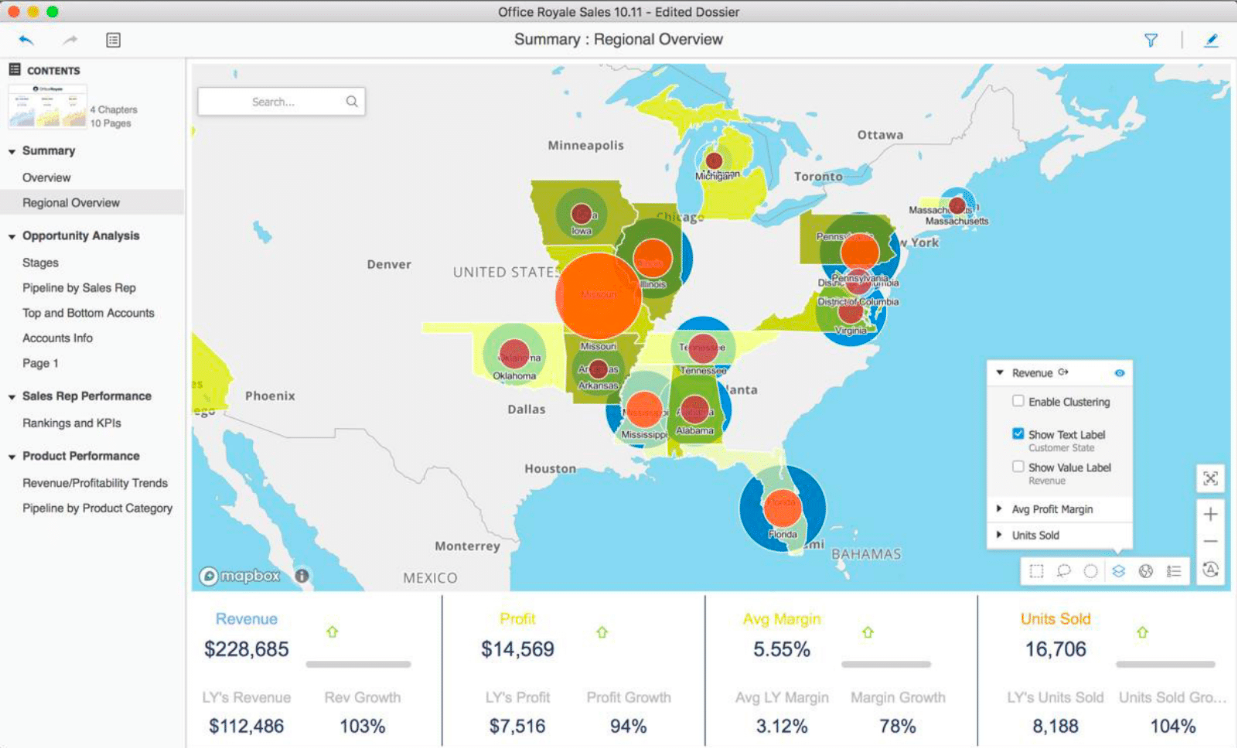
A sales leader for a national retail chain asks, “How well is my product doing at the state level? ”MicroStrategy now gives them full control over what data is displayed when, blending multiple datasets intelligently.
The map below shows multiple metrics combined in a single map, with markers, bubbles, and area charts to show revenues, profits, margins, and units sold by state.
Take it for a spin
Want to get started with MicroStrategy’s new Geospatial Services? Visit the What’s New in MicroStrategy 10 site and register for the upcoming webcast on Wednesday, May 16, 2018, at 2:00 p.m. EDT.
Need more geospatial capabilities in MicroStrategy? Stay tuned for new roadmap announcements from the MicroStrategy team, or contact Mapbox to talk about a custom integration.
We’d love to see what you build with Mapbox in MicroStrategy— tweet @Mapbox or drop me a line at julie.munro@mapbox.com!